Perspectives January 28, 2022

Why the ‘gold standard’ of data collection is no longer enough

A lineup of industry experts weighs in on biases in data used for architecture and design

Inequity in data collection has long had far-reaching effects on the populous at large. For example, as Dr. Vernelle A. A, Noel, a professor of architecture at Georgia Tech, pointed out in a presentation to AIA’s Technology in Architecture Practice (TAP) community last week, the U.S. census has historically undercounted the country’s Black population, contributing to innumerable biases across every sector.

Even less forthright approaches to data collection lead to results that can trickle down to the simplest policy decisions and how built communities evolve, quietly adding discrimination to people’s lives, whether they are fully aware or not. Redlining, for example, is the creation of borders between typically affluent neighborhoods and those populated by racial and ethnic minorities, which leads to unequal allocation of funds and resources, credit rationing, and less access to healthcare or even food services.

Under such circumstances, the work of architects and designers can contribute to these issues if the firms use data that isn’t attained as equitably as possible. “We as architects have to be really careful about just taking data as this gold standard,” says Evan Troxel, founder and host of the TRXL Podcast, a show about the merging of technology and architecture. “Data doesn’t tell the whole story. They are points recorded in time, and whoever recorded it isn’t necessarily recording everything that’s important for the project.”

Last week, Troxel moderated a panel of experts as part of the same three-day course Noel presented for, focused on design, equity, and data. Troxel, Noel, and each of the panelists, including Gautam Sundaram, a Principal out of our Boston studio, went into detail on the effects inequitable data can have on communities after a project is built, what should be considered in data collection, and ways to broaden perspectives across our art form.
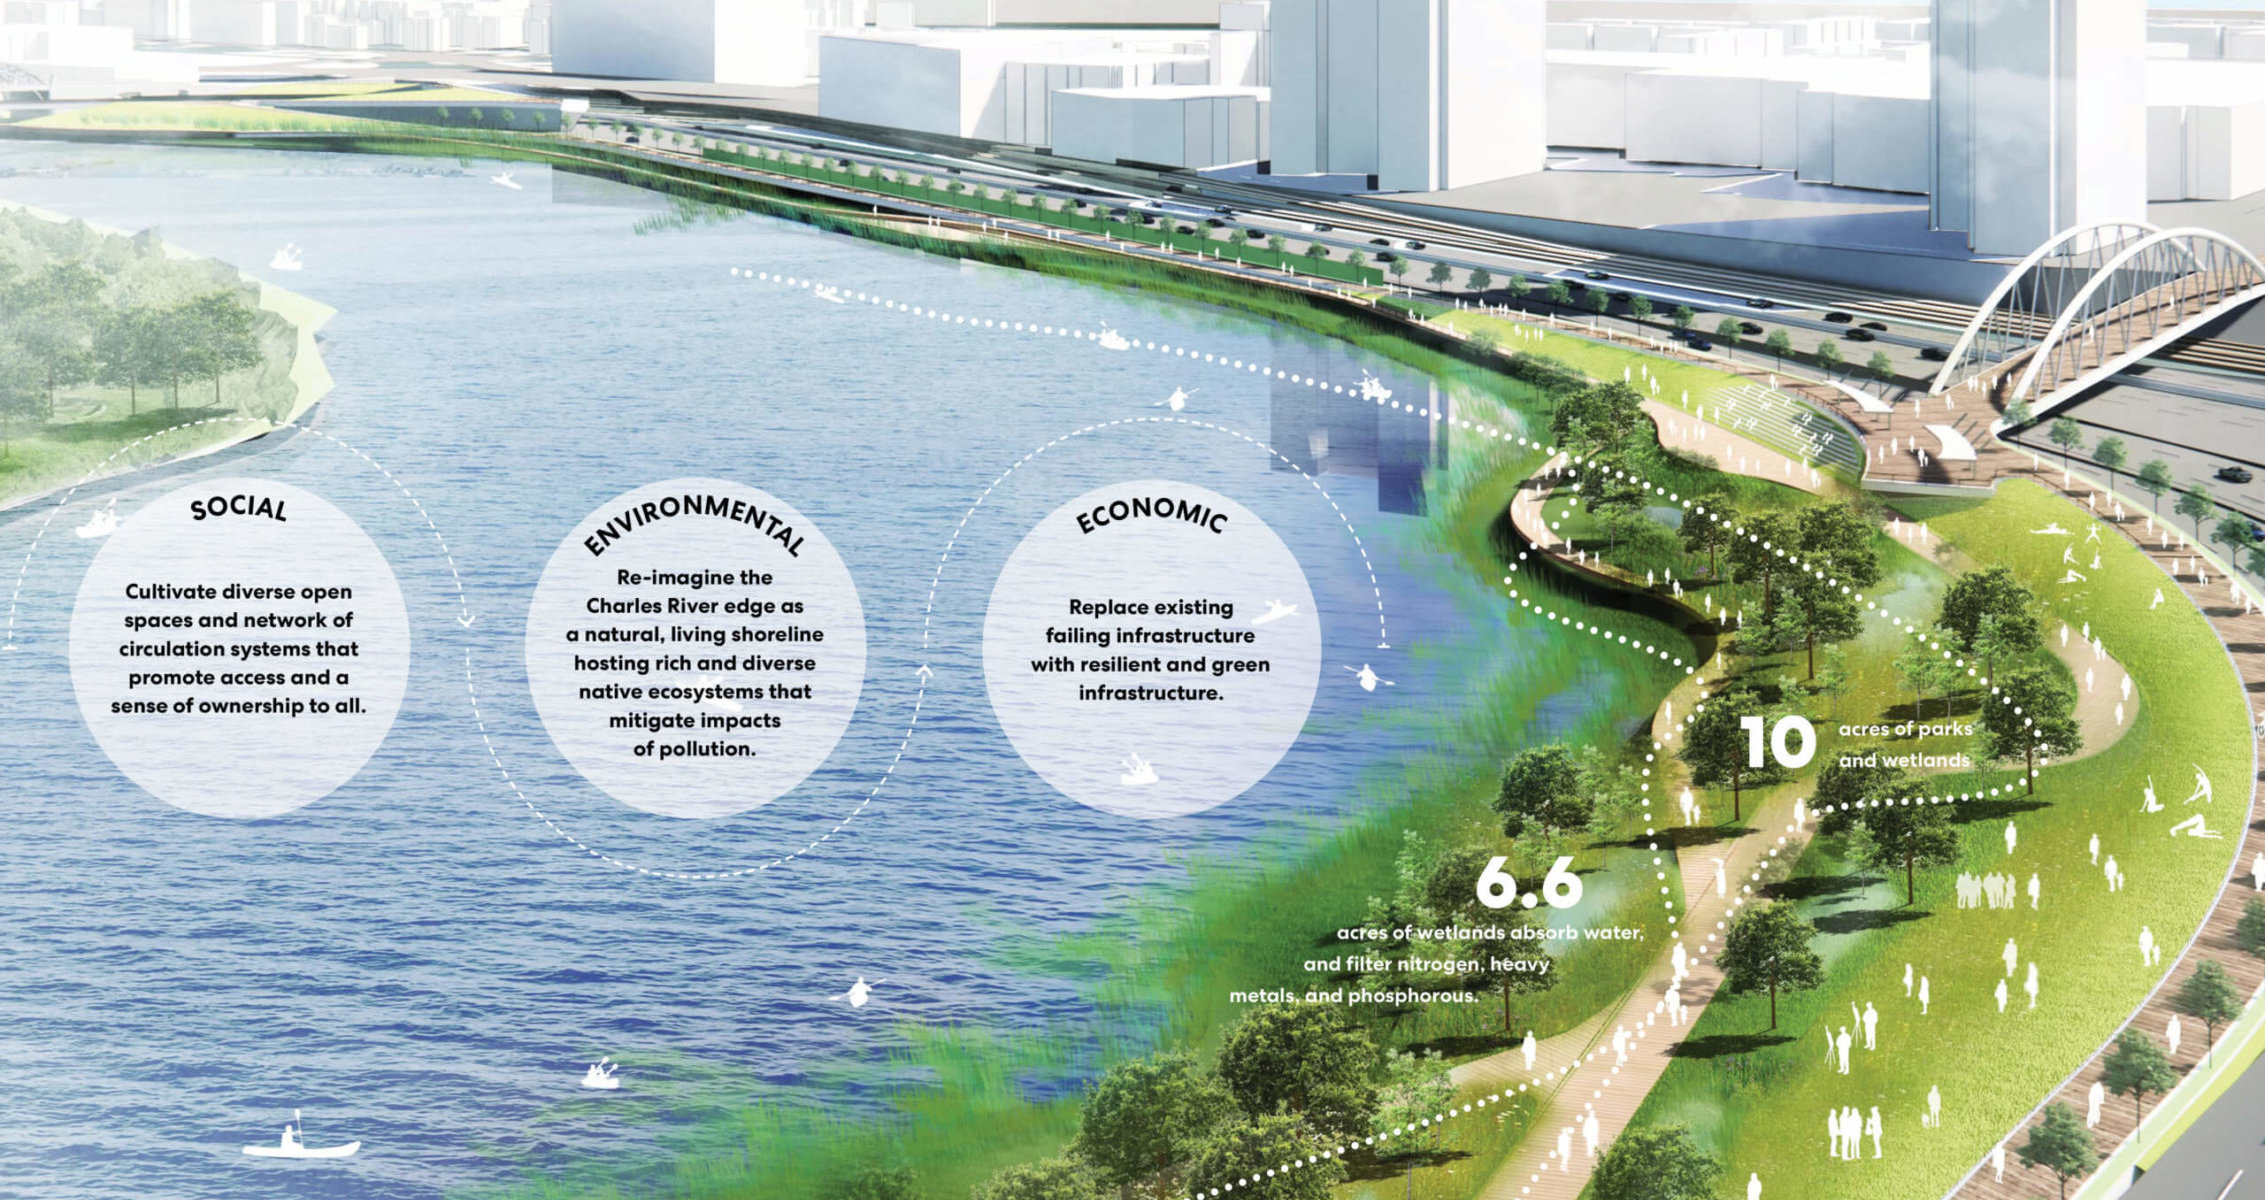
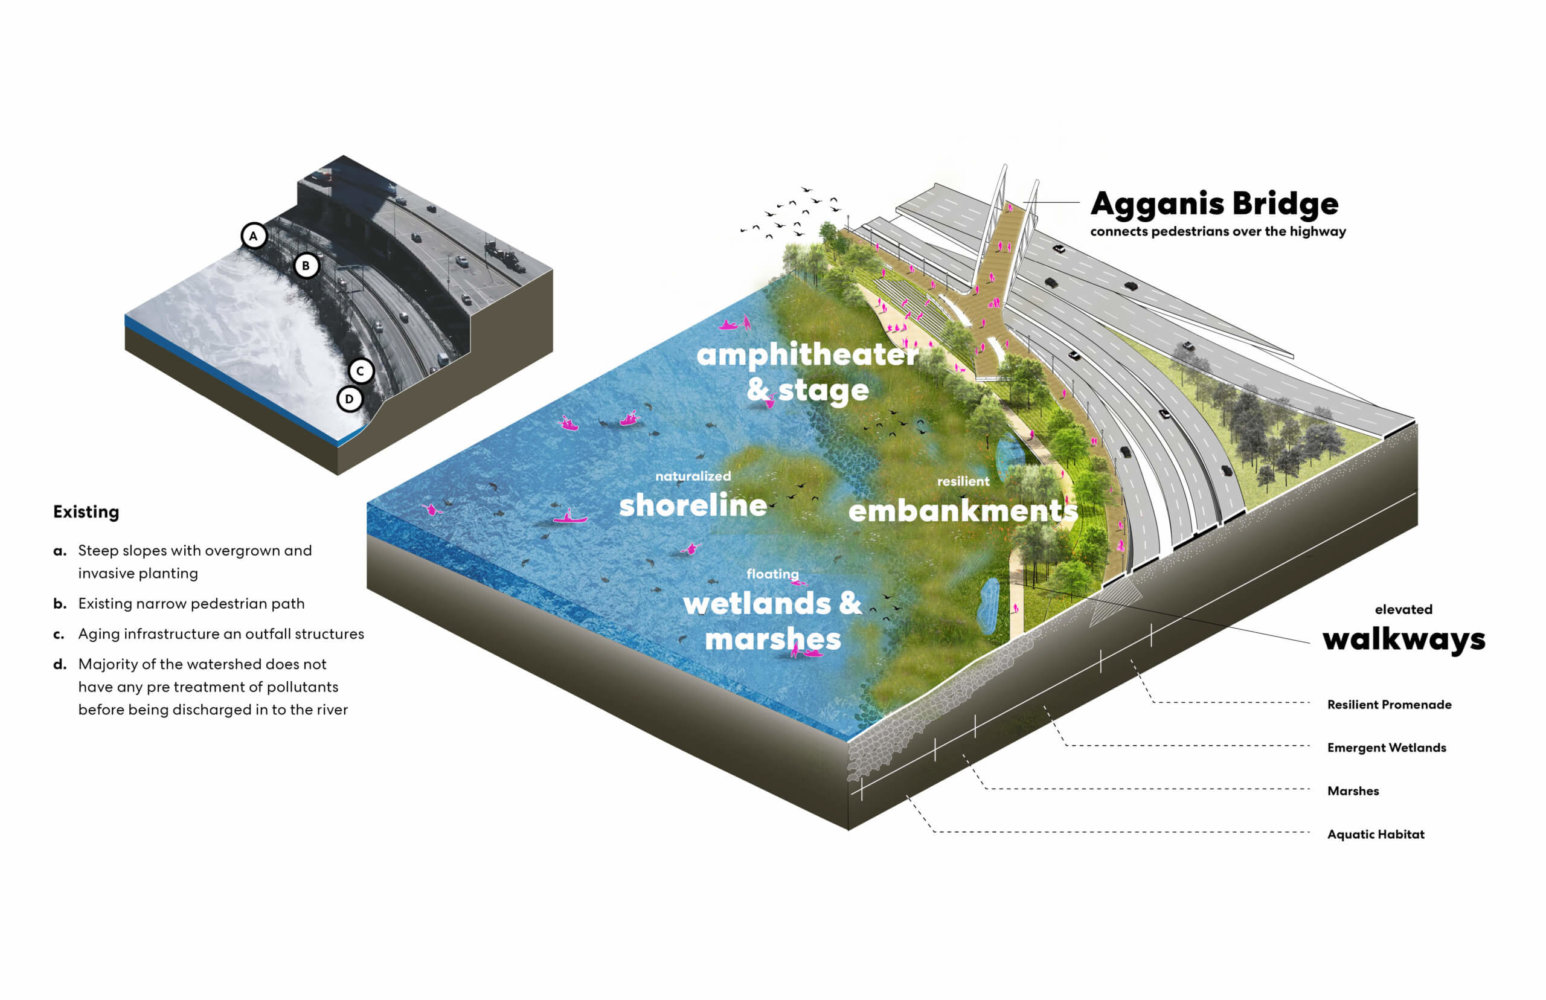
The plan for the shoreline in Boston, where climate change threatens nearby roadways.

Getting the Whole Story

Raising the volume on the conversation around equity in data and design for today’s sociopolitical climate doesn’t change the fact that these discrepancies have been occurring for decades. “We pretend that big data is new right now, but this isn’t new. Redlining isn’t new. The only new thing is that we have these technologies to increase the pace of how we use data,” Noel says. “But we’ve always been using data for bad things—that’s the history of humanity.”

Her presentation to the AIA TAP community primarily focused on the stories of individuals in Trinidad and Tobago, shedding light on the human stories at the center of her research. “Data is tied to a place, people, culture, identity, and history,” she told the audience. Part of the solution for architects then becomes gathering more information on the community a project is intended for. One way Noel is doing this is her Artificial Intelligence + Carnival + Creativity organization, which empowers Black and Caribbean communities to engage with technology as they experience and celebrate art from creatives like them, thus bringing human stories to the forefront.

On the opposite end, historical data on how underserved communities face oppression via economics and policymaking offers another piece of the puzzle. Our Living Urban Districts research initiative, for example, is aimed directly at the relationship between the public, equity, and the effects of COVID-19, exploring how a decades-long lack of resiliency planning on the district level led to clear displays of social inequity during the pandemic in three cities: San Francisco, Toronto, and Atlanta.

The San Francisco case study in particular shows how urban disinvestment, accelerated Black displacement, the rise of Silicon Valley, and other factors caused a decline in urban housing production, resulting in overcrowding in densely populated, predominantly Black areas. During the pandemic, that meant a much higher number of cases in these neighborhoods than others, all because of years of development based on data stretching back to the 1970s. “If you have a preconceived agenda to push, you could look at a selective amount of data to push it,” says Sundaram, lead advisor of the initiative.

The Importance of Community Outreach

As technology has further standardized data, important decisions for communities and the people living in them are made according to numbers. “It reduces humanity to bits and bytes,” Noel says. But, as Moody Nolan Project Manager Dawne David-Pierre poses, “What story is behind the people who generate the numbers?”

Her team is currently working on a cultural project in Buffalo, New York, but the available data gathered pertaining to the surrounding area shows mostly vacant lots. “The numbers say no one lives in this neighborhood, that there’s no development,” she explains. “But that doesn’t tell the story of, for example, the community trying to save this 150-year-old church that was one of the last stops on the Underground Railroad.”

A major consequence of data’s effect on such communities has been mistrust from residents living in areas where new projects are proposed to be built. Elizabeth Christoforetti, Founding Principal at Boston-based firm Supernormal, points to a neighborhood plan her team is working on to both revise zoning guidelines and add more affordable housing. The plan calls for higher population density in the neighborhood, something many residents voiced concerns over. “It has to come back to what does the neighborhood want?” she says. “You have to bring the data that you know will help the area back to the individual. It’s storytelling, really. Data humanism, if you will.”

In a similar vein, leaders within our Social Purpose program proposed the rerouting of major highway I-90 in the Harvard area through Boston to avoid the effects climate change is likely to have on the Charles River. The stakeholders and the larger community were worried about how it would disrupt the flow of the city, but once our team presented research on the risks of leaving the road as is, they were able to achieve a consensus among the stakeholders and get approval from the Massachusetts governor. “When you start community outreach from the beginning, it gets to a point where everyone understands the problem we’re trying to solve,” says Sundaram. “To me, that’s the power of advocacy.”

Plans for the I-90 highway project in Boston.

A New Gold Standard?

That said, data collecting methods are not going to be corrected and equity achieved overnight. Through our Living Urban Districts initiative, one can see how decades of small shifts led to a perfect storm for COVID-19 to disproportionately affect communities of color in densely populated cities. “Equity has been a big part of our conversation,” Sundaram says. “If you bring a broader network of data, you can start to bring equity into design.”

But mitigating this issue goes beyond asking the right questions on a form. It requires educating the architecture industry at large, including clients, so that we are all looking closer at the data, how it was collected, and who collected it. A greater sense of communion between competing practices may go a long way toward the greater good. “Firms should share resources and act more like a community,” Troxel says. “It’s not only a huge opportunity for us, but for the people our work serves after we’ve moved onto the next project.”